Ethereum may break through the ascending triangle and reach $5,200 | CoinDesk JAPAN

- Ethereum’s weekly chart showed an ascending triangle breakout.
- According to Kraken OTC technical analysis, this triangle pattern has a target price of $5,200.
Ethereum (ETH) may have broken out of the “ascending triangle†pattern and found its way to an all-time high of $5,200, according to Kraken OTC technical analysis.
ETH, the second-largest crypto asset (virtual currency) by market capitalization, breached the $3,000 mark earlier this week, gaining a foothold above the horizontal trend line connecting the highs of August 2022 and April 2023. Built. This trendline forms an ascending triangle on the weekly chart, along with an upward-sloping bottom line connecting the June 2022 and November 2022 lows.
In other words, the bulls have broken through long-standing resistance and regained control of the market after a series of new highs that gradually weakened the bears’ power.
“ETH remains below the $2,141 upper limit of the ascending triangle formation, which is a key pivot on the weekly chart. This shape infers a target of around $5,200, which is an all-time high for ETH.†said Kraken OTC in a newsletter shared with CoinDesk on February 21st.
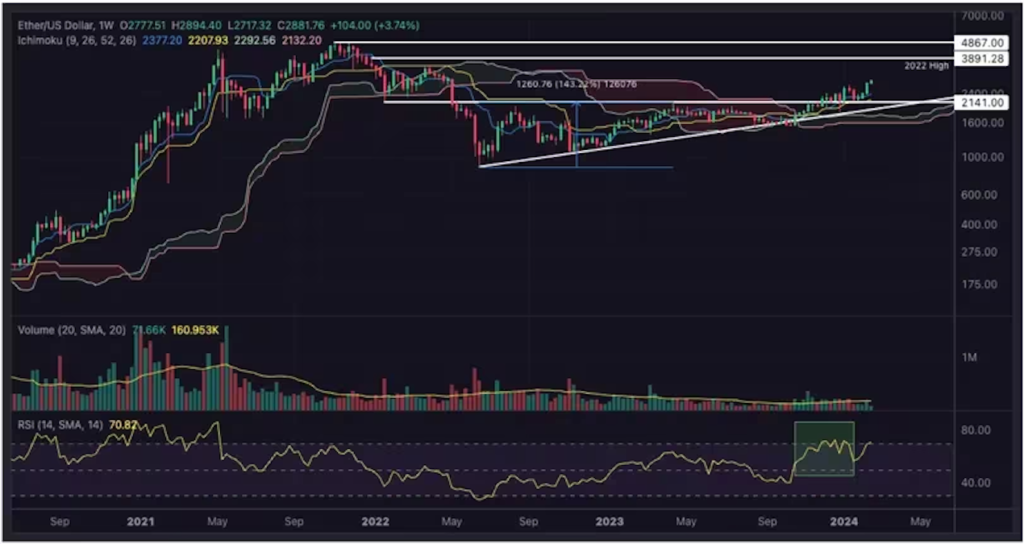
Ethereum has toyed with the upper side of the ascending triangle several times since early December, rising to a high of $2,700 at one point in early January.
However, the price quickly retreated to the breakout point (top of the triangle), testing the bullish buying demand, but with support from the bulls, the previous resistance-turned-support section remained solid, continuing the bullish trend. The transformation progressed.
According to Kraken OTC, other indicators like Ichimoku Kinko Hyo are also showing bullishness.
The Ichimoku Kinko Hyo was devised by Japanese journalist Goichi Hosoda in the 1960s and consists of five lines: leading span A, leading span B, conversion line, reference line, and lagging span. The spread between leading span A and leading span B forms a “cloudâ€. Bullish clouds are green, bearish clouds are red. Crossovers above and below the cloud represent changes in bullish and bearish trends.
At the time of writing, Ethereum is trading above the Ichimoku Kinko Hyo cloud on the weekly chart.
“According to the weekly Ichimoku Kinko Hyo model, ETH is in a bullish position, above the conversion line, the reference line, and the Ichimoku Kinko Hyo itself. The key level to watch is $2,141, below which a close is This will invalidate the ascending triangle pattern,†Kraken OTC added.
The bullishness on the chart is consistent with a positive fundamental supply outlook. According to some analysts, the supply of Ethereum has decreased significantly since it transitioned to proof-of-stake, making it ripe for a rally.
|Translation: CoinDesk JAPAN
|Edited by: Toshihiko Inoue
|Image: Kraken OTC, TradingView
|Original text: Ether’s Triangle Breakout Could Push It to New All-Time High of $5.2K: Kraken OTC
The post Ethereum may break through the ascending triangle and reach $5,200 | CoinDesk JAPAN appeared first on Our Bitcoin News.