Bitcoin monthly chart suggests a trend change signal, with a short-term possibility of testing the top price | Contributed by a bitbank analyst

Virtual currency market prices from 1/27 (Sat) to 2/2 (Fri) this week
Mr. Hasegawa, an analyst at Bitbank, a major domestic exchange, illustrates this week’s Bitcoin chart and deciphers the future outlook.
- table of contents
-
- Bitcoin on-chain data
- bitbank contribution
Bitcoin on-chain data
Number of BTC transactions
Number of BTC transactions (monthly)
Number of active addresses
Number of active addresses (monthly)
BTC mining pool remittance destination
Exchange/Other services
bitbank analyst analysis (contributed by Tomoya Hasegawa)
Weekly report from 1/27 (Sat) to 2/2 (Fri):
Bitcoin (BTC) vs. yen has been firm this week, with the pair trading around 6.3 million yen.
At the beginning of the week in the US, the trading value of IBIT (BlackRock Spot Bitcoin ETF) exceeded that of GBTC (Grayscale ETF), giving a positive impression of the improvement in supply and demand related to ETFs, with BTC reaching 6.3 million yen. The yen recovered to 6.4 million yen by Asian time on the 30th.
On the other hand, after the US market closed on that day, Alphabet’s results showed a decline in Google Ad revenue, leading to a sharp decline in US stocks and BTC as well. The following day, on the 31st, the price fell to around 6.3 million yen due to caution ahead of the US Federal Open Market Committee (FOMC) meeting, but when the January ADP employment report showed that the number of monthly changes in employment was lower than market expectations, The market price rebounded to around 6.4 million yen.
However, at the FOMC meeting, which ended in the early hours of the 1st, the statement clearly stated that it would not be appropriate to cut interest rates until there was confidence that inflation was continuing to move towards the 2% target, and Fed Chairman Jerome Powell stated in a press conference that After he said that the start of interest rate cuts in March was “not the base case,†BTC fell, and at one point fell below 6.2 million yen in Asian time on the 1st.
However, if the market price stops declining at around 6.17 million yen, where the center line of the Bollinger Bands and the cloud upper limit of the Ichimoku Kinko Hyo are concentrated, concerns about the management of mid-sized US banks will be reignited due to NY Community Bancorp’s (NYCB) deficit and dividend cuts. , which rebounded to 6.3 million yen, reversing the steep decline in the highest yield in the United States due to the worsening number of unemployment insurance applications.
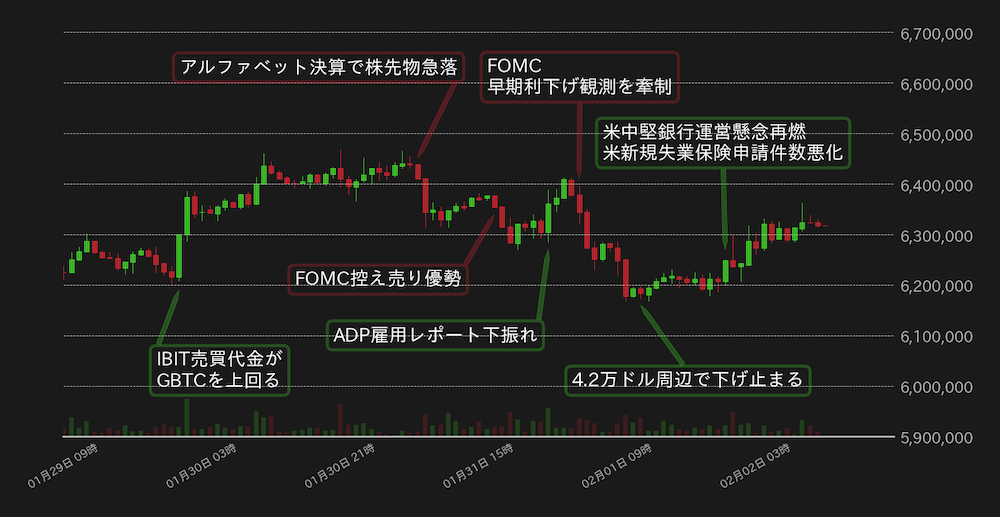
Figure 1: BTC vs. Yen chart (1 hour timeframe) Source: Created from bitbank.cc
The January FOMC meeting was designed to check the market’s expectations for an early interest rate cut, and it can be said that the FOMC has shifted to a somewhat hawkish stance.
However, the market’s expectations for a March interest rate cut had gradually receded even before the FOMC meeting, so the impact on the BTC market was not that great.
Although it appears that the Fed still does not want to make the market conscious of a rate cut, in the federal funds rate futures market, many expect interest rates to begin cutting in May.
At the time of the March FOMC meeting, only personal consumption expenditure (PCE) price index data up to January had been released, but at the time of the May FOMC meeting, data up to March would be available.
Considering the pace of deceleration in the PCE price index and consumer price index (CPI) in recent months, we believe it is still a delicate line whether we can be confident that inflation will settle down to 2% as of May, but it is possible. Isn’t it zero?
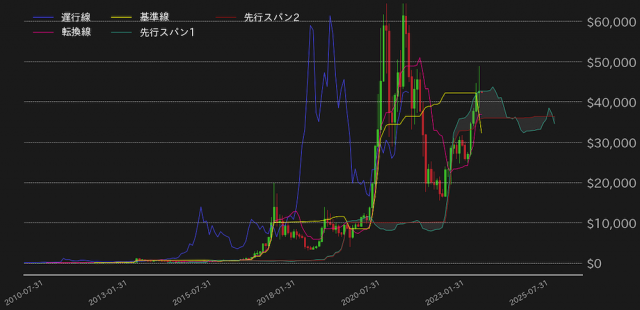
BTC maintains its daily 100-day moving average against the dollar, showing its strength in reversing the triple role reversal in Ichimoku Kinko Hyo, but as January ends, BTC’s monthly trend changes. The shape is similar to that of a line that simultaneously pulls and pulls as a signal.
In addition, according to the monthly Ichimoku Kinko Hyo, the high price is above the upper limit of the cloud, but the closing price has failed to maintain the same level, and the resistance in the mid to high $40,000 range seems to be quite strong.
In the short term, BTC is likely to test its upside due to hedging due to concerns about the operations of mid-sized US banks and data showing a slowdown in the US labor market, and if it succeeds in breaking out above $44,000, it will consolidate and move higher. Although it has been pointed out that the market price will go up, we believe that there will be a reversal and selling at around $46,000, which was the point at which ETF trading began in the United States.
connection:bitbank_markets official website
Previous report:Bitcoin has fallen below the 6 million yen level, wary of further depreciation
The post Bitcoin monthly chart suggests a trend change signal, with a short-term possibility of testing the top price | Contributed by a bitbank analyst appeared first on Our Bitcoin News.