Bitcoin’s Illiquid Supply Hits All-Time High As Holders Withdraw 1.7M BTC Since May 2021: Here’s The Next Resistance

The post Bitcoin’s Illiquid Supply Hits All-Time High As Holders Withdraw 1.7M BTC Since May 2021: Here’s The Next Resistance appeared first on Coinpedia Fintech News
Bitcoin’s price is on the edge of reaching the $40,000 dream this weekend, accompanied by a significant shift in on-chain data. There is a noticeable hesitancy among investors to part with their Bitcoin holdings, leading to an upswing in illiquid supply. Consequently, as holders continue in their Bitcoin accumulation, purchasing confidence strengthens in anticipation of potential price increases.
Investors Buy BTC As NVT Flashes Cheap Zone
Bitcoin is currently witnessing an accumulation phase as it tests buyers’ patience at the $37K-$38K zone. Data from Glassnode reveals that Bitcoin’s illiquid supply continues to increase, and it has recently touched an all-time high. This metric, which tracks the quantity of Bitcoin held in wallets that rarely engage in sales, has reached a new high at 15.4 million BTC.
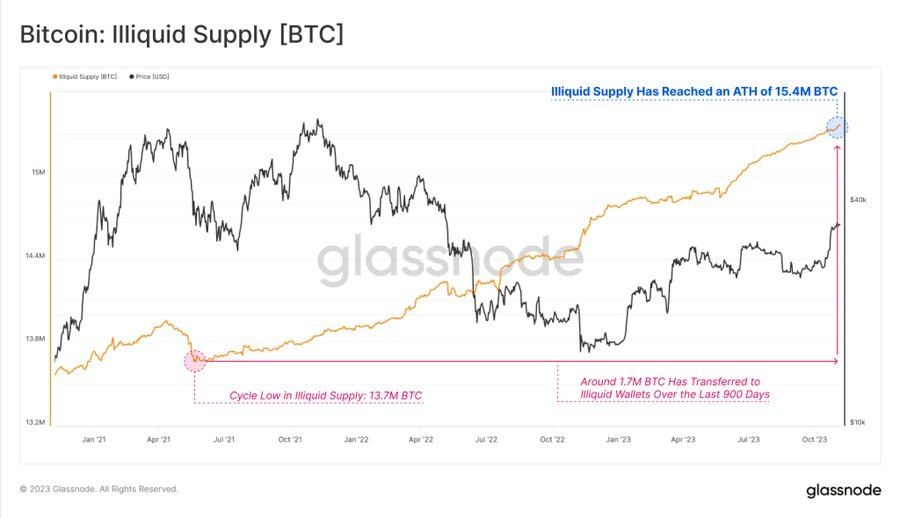
The rise in this metric frequently correlates with increased withdrawals from exchanges, indicating the trend of investors transferring their Bitcoin to personal custody. Since May 2021, there has been a noteworthy increment of over 1.7 million BTC being moved off exchanges, thereby strengthening buying confidence as investors accumulate BTC in anticipation of a surge.
Additionally, on-chain data indicates that Bitcoin’s $37K zone is still cheap as the NVT ratio continues to decline. IntoTheBlock reveals a steep decline in the NVT ratio (Network Value to Transaction) as it dropped from a high of 123 to 44.

This decline is due to Bitcoin transaction volume growing more rapidly than its price surge. Typically, increased activity on the Bitcoin network suggests a positive market outlook. The fact that this network activity surpasses the rate of Bitcoin’s price increase suggests that Bitcoin may be undervalued.
The NVT ratio is an indicator comparing Bitcoin’s market value to its transaction volume. It’s calculated by dividing Bitcoin’s market cap—its price times the number in circulation—by the sum of Bitcoin moved between wallets.
What’s Next For BTC Price?
Bitcoin’s current trading pattern, a slight ascending channel, suggests a bullish attitude among investors. Buyers are currently attempting to validate a clear move above $38K as BTC faces minor selling practices. As of writing, BTC price trades at $37,344, surging over 2.4% in the last 24 hours.
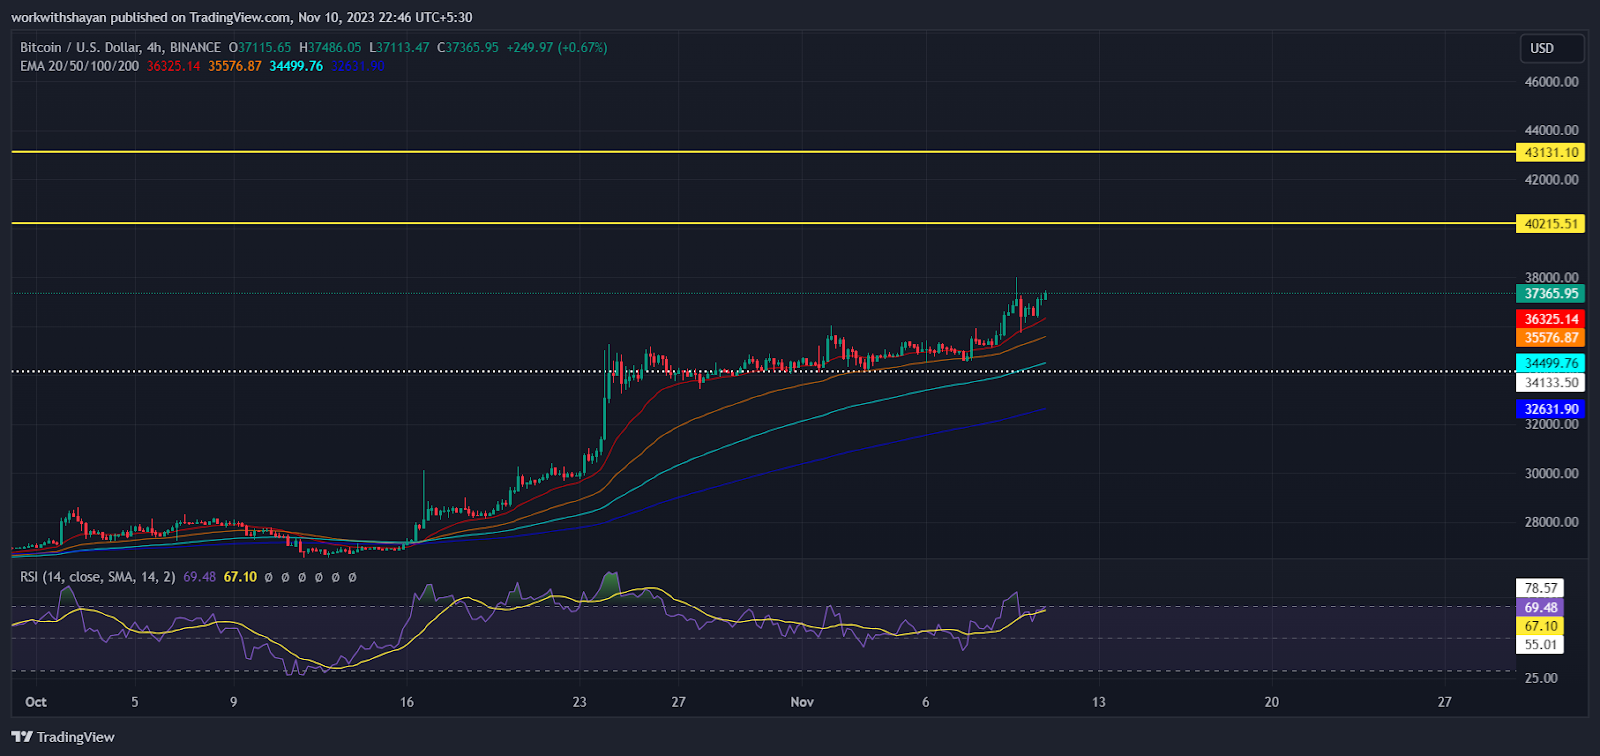
Bitcoin’s 4-hour price chart reveals that the slowly climbing 20-day exponential moving average (EMA) and an overbought relative strength index (RSI) hint that a further upward trend might be the path of least resistance. A momentum above the $38K level could signal a bullish rally toward the $40K level.
Conversely, a downturn below the 20-day EMA may indicate profit-taking by current holders, which could send the price tumbling to support levels of $34K and possibly further down to $32,700. However, these levels will likely be defended by buyers as increasing accumulation is anticipated.