Is Ethereum (ETH) Price Gearing up For Fresh Rally Or More BloodBath On Horizon?

The post Is Ethereum (ETH) Price Gearing up For Fresh Rally Or More BloodBath On Horizon? appeared first on Coinpedia Fintech News
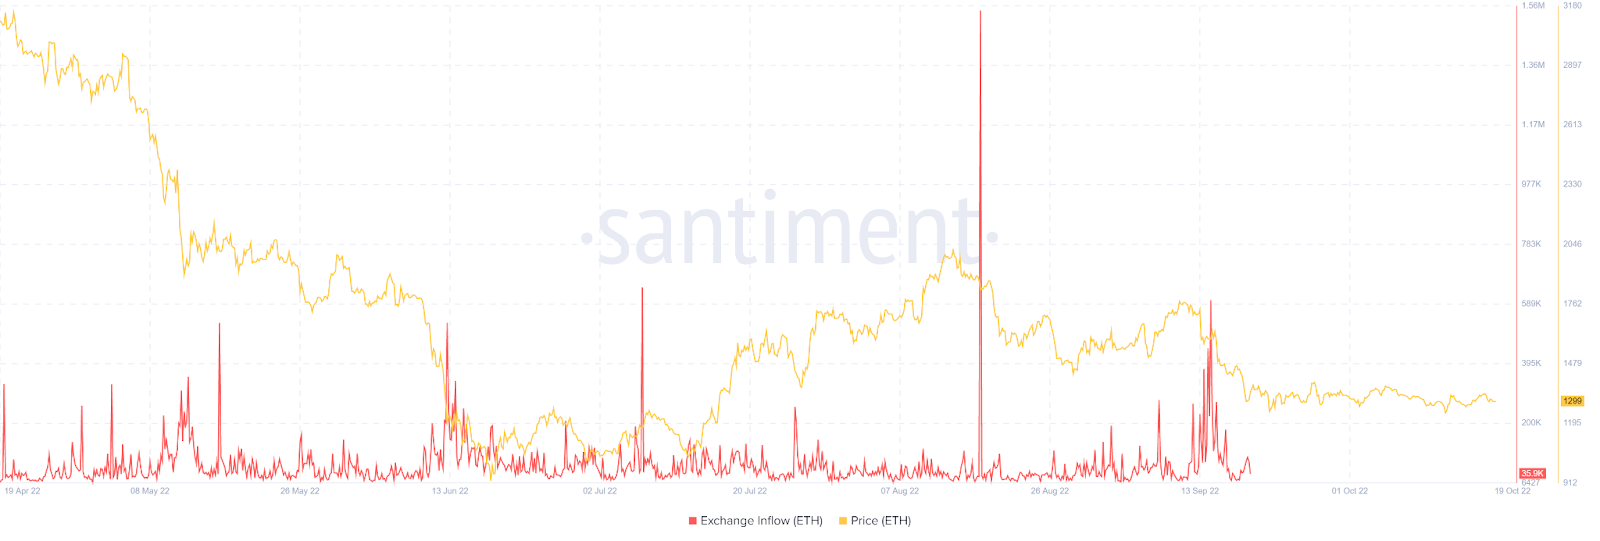
Ethereum is failing to find an upward way to make a bullish momentum as it suddenly made a bearish reversal from $1,341 on 18 October. It seems that ETH’s whale investors are playing a pump-and-dump game to maximize their profits amid the market crash.
Ethereum was expected to be the crypto community’s favorite after the succession of the much-anticipated Merge event, but it drastically failed to add any value.
The bearish trend has been fully controlled by institutional investors since Merge, and the downtrend will continue further with some twists.
Ethereum Aims For A Breakout!
Ethereum recently attempted to make a breakout at $1,341 but faced rejection and had a swift decline over 24 hours. Ethereum has been trading in a consolidated range between $1,250 and $1,300 for a month. Above the $1,300 level, bulls may take over control and push ETH’s price to the North.
However, bears are also not out of the league as the selling pressure of Ethereum continues, and we can likely see Ethereum test a support level at $1,270. According to CoinMarketCap, Ethereum is currently trading at $1,298, with a downtrend of nearly 3% from yesterday.
Ethereum: Technical Analysis
Looking at the 4-hour Ethereum price chart, Ethereum made a sharp decline since facing rejection at $1,341, and even reached near its crucial support level at $1,280 with a trend line below the 55-SMA (simple moving average).
This week has been highly volatile for Ethereum as it saw a fresh increase near the $1,260 resistance area. Ethereum saw a break above the 50% Fib retracement during the CPI data and touched a high of $1,342 from a low of $1,190.
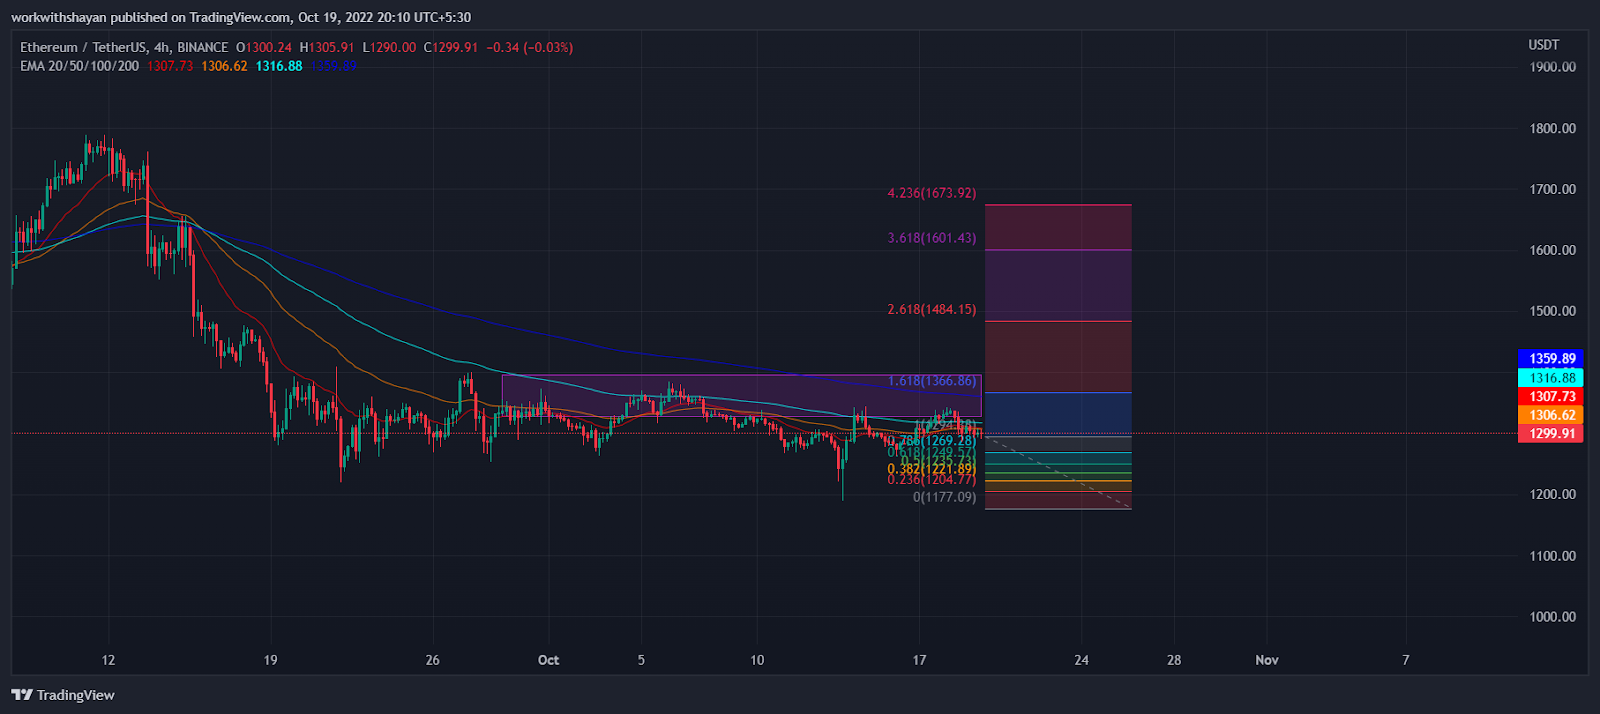
According to our Ethereum technical analysis, Ethereum is facing a rejection near $1,340 due to selling pressure, and it is near the 76.4% Fib retracement of the current downward move. EMA-20 is trading in a bearish line at $1,320, making it an immediate resistance level in the price chart.
If Ethereum holds its price above this level, we can see its price move to the next resistance level of $1,395, where EMA-50 is currently trading. The Bollinger band’s upper limit is at $1,470, which is a strong resistance level in the Ethereum price chart.
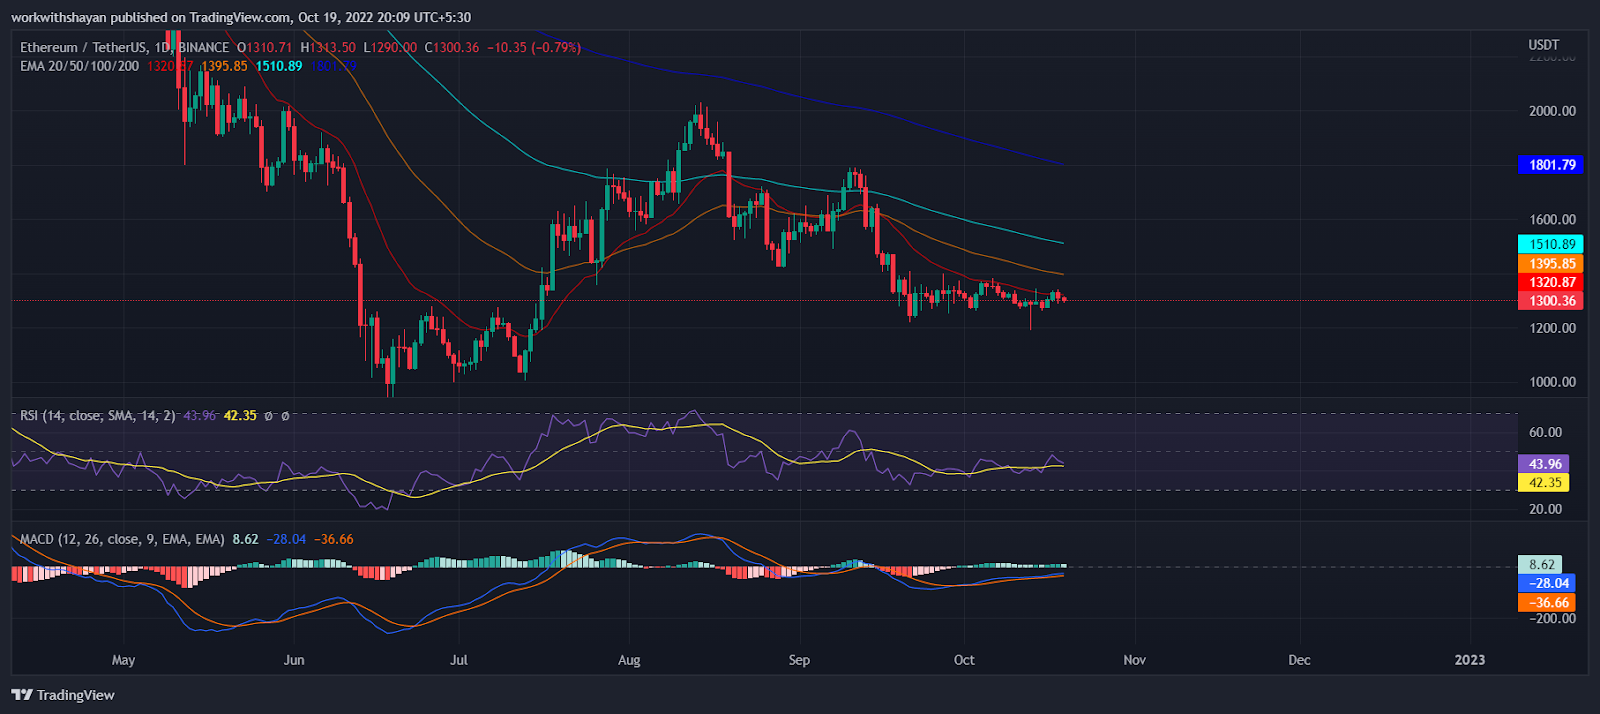
Conversely, the Bollinger band’s lower limit is at $1,242. If this support level breaks, Ethereum may plunge hard to the bottom line and trade below $1,024.
The RSI-14 is also not impressive as it trades near 42-level, hinting that the bears’ domination will continue further if Ethereum does not make an upward breakout. The MACD line also indicates that the bloodbath of Ethereum is not over yet.