Bitcoin 3-Day Death Cross! BTC Price To Plunge More In Coming Days

The post Bitcoin 3-Day Death Cross! BTC Price To Plunge More In Coming Days appeared first on Coinpedia – Fintech & Cryptocurreny News Media| Crypto Guide
Following the bloodshed in the US markets, Bitcoin, Cryptocurrencies, and other financial assets markets fell heavily on Friday.
As per the stock market experts, the market right now is extremely fragile due to the entrenched inflation and the recent hikes by the central banks to tame the same. Further other factors like war, stagflation risk, and global economic growth slowdown have spooked the investors globally and this led to a sharp fall in Nasdaq.
The Analysts have been carefully watching over the past few months to see if Bitcoin would form a 3-day death cross.
Steve, the famous YouTuber from Crypto Crew University, has given an in-depth analysis on the formation of a 3-day death cross he said -that indicator may predict the future moving average ( SMA ) values assuming the prices remain at configured level (-50% to +50%).
It can be used to predict golden/death crosses as well – when two of these indicators are on – one configured for length 50 and one for length 200.
Also Read : Will Bitcoin Bears Continue To Rule in MAY Month? What’s Next For BTC Price?
Another Bitcoin Death Cross On the horizon?
As discussed by Steve this all started to happen in early January, the BTC leverage ratio, reached its all-time high. It also indicated that investors took a greater risk in the crypto market.

Steve says
“It’s not a welcome sight for bulls when you see the 3-day death formation,â€. And yet, the death cross is exactly what emerged on Bitcoin’s price charts yesterday, and it’s “top of mind for all technical analystsâ€.
Recently, Bitcoin’s 50-day average fell below its 200-day moving average, triggering a death cross signal and causing reason for concern to some investors.
Bitcoin Bull Run By Year-End?
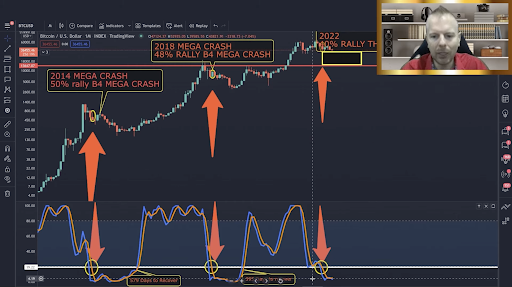
With reference to the above chart, The stochastic RSI cross down to the bottom level. The same pattern appeared in 2014 and 2018. During this time period, BTC/USDT price rallied nearly 50% before a mega crash.
Thus, the same pattern appeared in 2022 the bitcoin price rallied 40% before plunging heavily. The analyst explains that in both 2014 and 2018 the flagship currency took nearly 100 days to big the next bull run. Thus, if history repeats we can expect bull by end of the year.
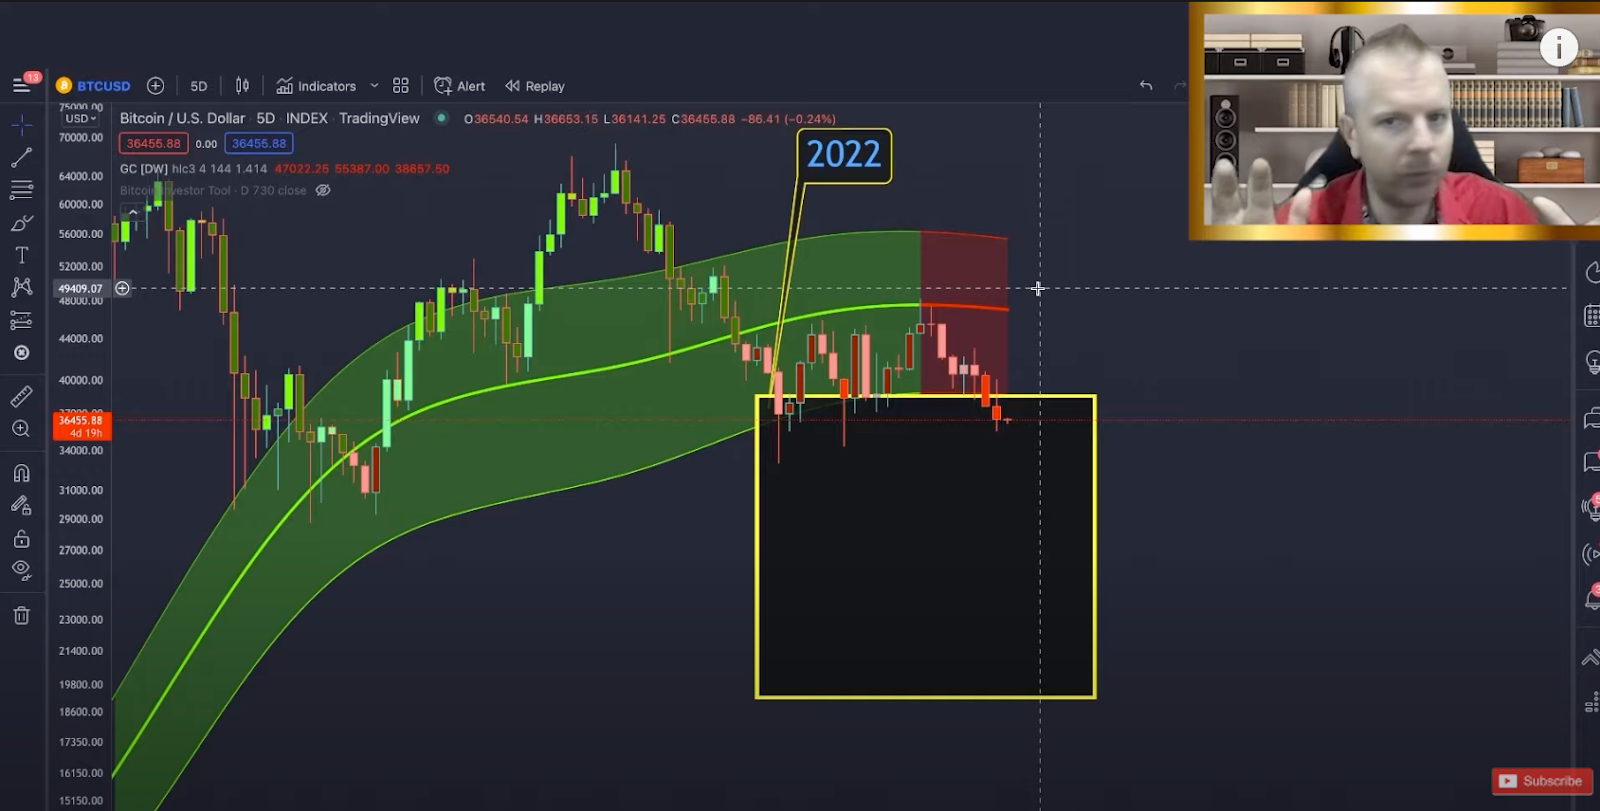
As per the Gaussian Channel, In the above chart, the bearish turmoil will end once the red area turns to green. Right now it got rejected from the median line. According to analysts when we enter the golden zone ( the zone right below the Gaussian Channel) that’s the best buying opportunity for traders.
Bitcoin Bear FlagÂ
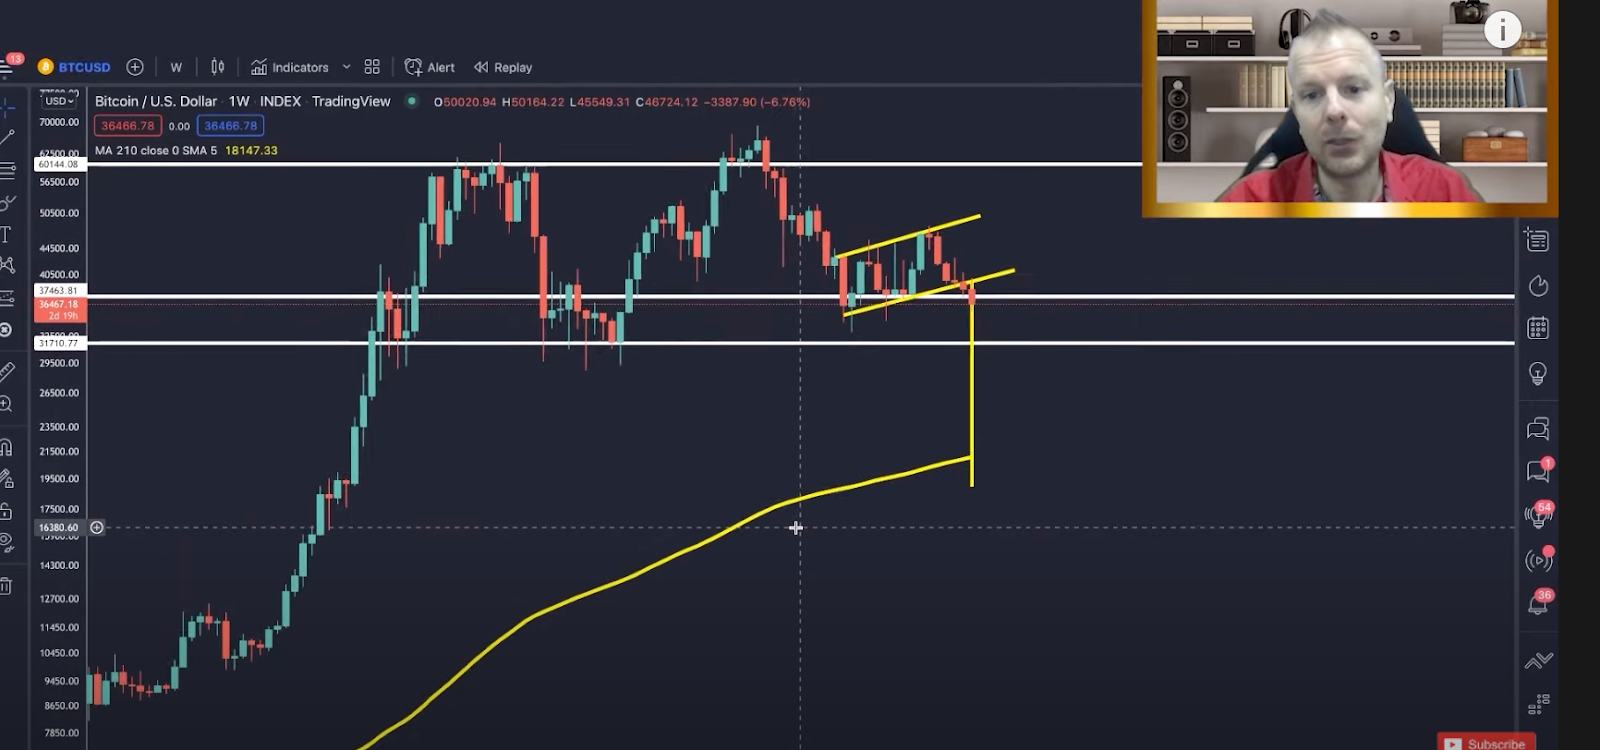
Bitcoin has lost around 13% this month and is on target to test support from the lower end of a so-called “bearish flagâ€. Looking at The 210-weekly moving average, the analyst says that the BTC Price might hit the potential low of $20K ( the level at which the bear flag pole meets the 210-weekly moving average).
Overall, The analyst believe there is more downtrend on the horizon. No doubt, we might see short-term rallies but the bears are still in control.