Bitcoin (BTC) Price Poised To Rally More Than 50% Very Soon! Here’s Why and When

The post Bitcoin (BTC) Price Poised To Rally More Than 50% Very Soon! Here’s Why and When appeared first on Coinpedia Fintech News
In the last 24 hours, the Bitcoin market has experienced a surge in volatility, outpacing the altcoin market. According to the latest cryptocurrency price oracles, Bitcoin has gained over 11 percent, trading at around $24.6k. As a result, Bitcoin’s market dominance has increased to 42.7 percent with a valuation of approximately $475,565,209,571.
Bitcoin Price Rally To $56K
According to William Noble, a chart analyst and former analyst at Goldman Sachs and Morgan Stanley, Bitcoin may see a significant rally in the coming months that could more than double its current value. Noble notes that Bitcoin is breaking out from a long basing formation and that the saying “the bigger the base, the higher into space†may apply here.
He predicts that Bitcoin could make another parabolic move up to $56,000 with limited downticks, similar to its late 2020 surge from $20,000 to $40,000. The term “going parabolic†is often used in the cryptocurrency market to describe an expected impulsive move higher.
Bitcoin has recently shown a bullish trend, following a prolonged period of trading sideways at around $18,000, which some analysts refer to as a “basing patternâ€. One key indicator supporting the end of the downtrend is the bullish divergence of the relative strength index (RSI) on the weekly chart.
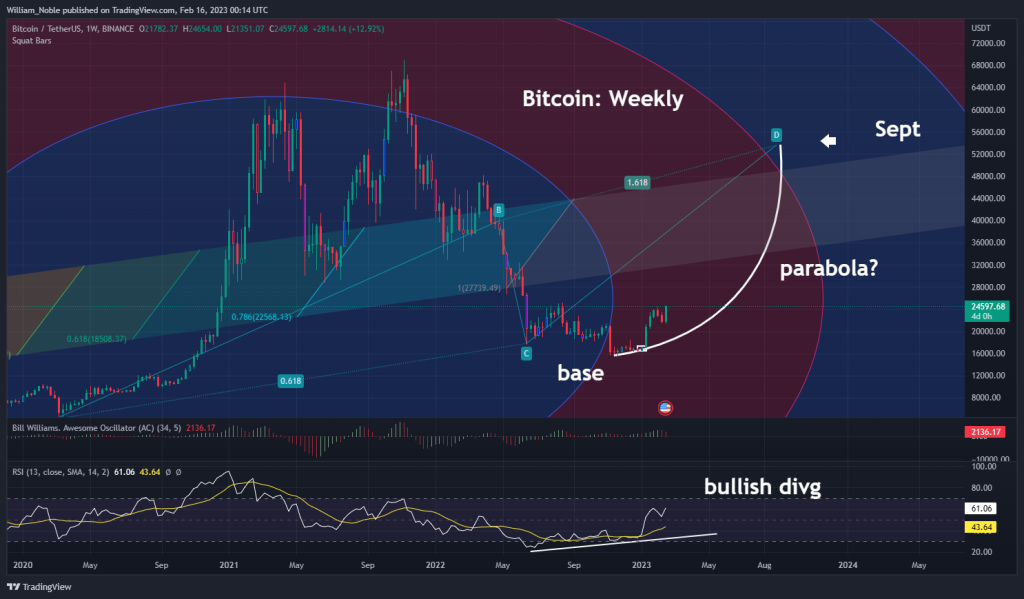
This occurs when the RSI does not mirror the new low in price, indicating a shift in power from bears to bulls. Additionally, the Nasdaq has broken out of a bull flag on the weekly chart, which can accelerate an uptrend. The correlation coefficient between Bitcoin and Nasdaq has also increased to 0.75, suggesting the two assets are moving in tandem.
A bull flag occurs when a correction follows a steep initial rise. Breaking out of this pattern can confirm a resumption of the broader uptrend. In October 2022, Nasdaq experienced a decline of 37% in 11 months, which looked like a correction in the broader rally from March 2020 lows and represented a flag pattern on the weekly chart. The recent bullish breakout from this pattern could indicate a new bull market in stocks, similar to the last bull market.
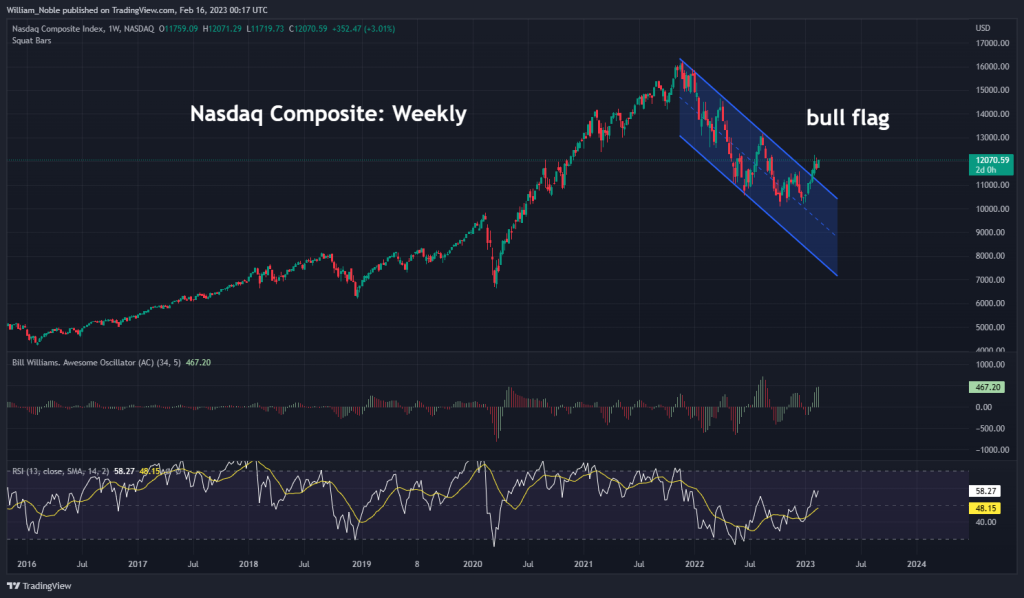
Analysts predict that 2023 could be a good year for both crypto and equities, with the potential for a significant run higher in equities to a new all-time high. In addition, the daily chart for Nasdaq also shows a bull flag breakout, adding further support to the bullish outlook.