These On-Chain Metrics Claim Bitcoin (BTC)Price Yet To Hit Bottom
The post These On-Chain Metrics Claim Bitcoin (BTC)Price Yet To Hit Bottom appeared first on Coinpedia – Fintech & Cryptocurreny News Media| Crypto Guide
In the last seven days, Bitcoin’s price has experienced the biggest decline in the last two months after the price dropped by 10%. The market speculators have revealed that Bitcoin has overtaken the technical charts heading toward a bearish pullback.
According to a financing service platform, Legacy Finance, a bear market is a situation where the market is under a price drop for too long. During this period, the platform claims that the assets will see a decline of 20% or more from their latest profits.
In the last ten months, the crypto market has bottomed nearly 74% from its top gains, hence this points toward a bear market for the world’s first cryptocurrency, Bitcoin.
June 18th was the day when Bitcoin formed a local bottom at around $17,700 for the first time in history. Though a few of the analysts name this as the market cycle bottom, several on-chain metrics indicate the opposite.
Bitcoin Addresses In Profit
When the percentage of Bitcoin addresses are in profit, it claims that a part of Bitcoin addresses investments have a lower buy price than the present price. The buying price is nothing but the price at which the asset was bought.
During every bottom cycle, 50% or below 50% of Bitcoin addresses have acquired losses. The below chart indicates 58% indicating more bearish days ahead for the Bitcoin price
Market Value To Realize Value (MVRV)
The market value to realize the value (MVRV) is nothing but the ratio between an asset’s market cap and realized cap which is also known as the value stored. This MVRV suggests if Bitcoin is above or below the fair value.
Meanwhile, when the long-term and short-term MVRV is compared, the data reveals long-term holders’ capitulation. Long-term holder MVRV (LTH-MVRV) points toward the transaction volume that is not spent during the last 155 days.
The consolidation of the STH-MVRV and LTH-MVRV lines was a defining feature of the previous four stages of bottoms. Given the lack of such an intersection, long-term holders may have to make way for short-term holders.
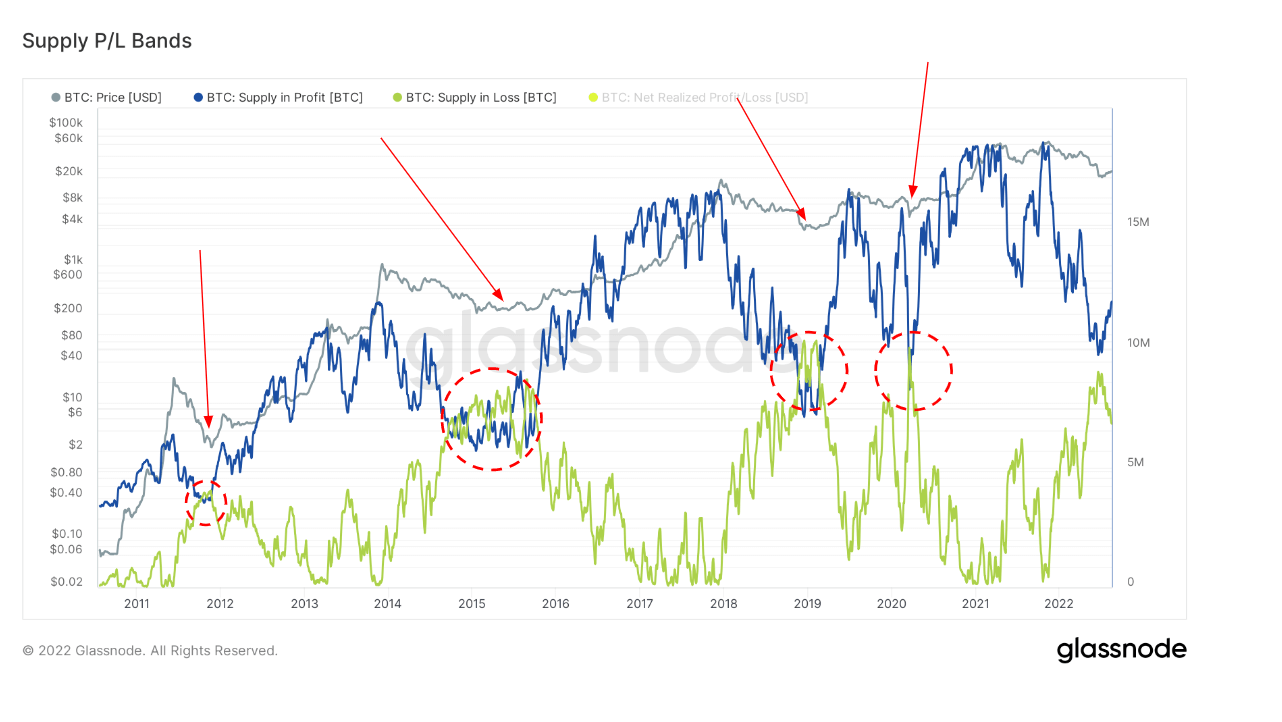
Supply In Profit & Loss (SPL)
The supply that is currently in circulation is examined in Supply in Profit and Loss (SPL). This means it considers how many tokens cost lower or higher than the one that is currently in effect the last time they changed.
The profit and loss lines integration signified an earlier bearish cycle, just like the last two illustrations. At the moment, the profit line is yet to form an intersection with the loss line.