BTC Price Fights the Immediate Resistance at $46,700 Displaying Signs of Smashing $100K in Q2 2022

The post BTC Price Fights the Immediate Resistance at $46,700 Displaying Signs of Smashing $100K in Q2 2022 appeared first on Coinpedia – Fintech & Cryptocurreny News Media| Crypto Guide
Bitcoin nowadays appears to have undertaken a calculated approach to nullify the steep drop towards the lower support. The BTC price is currently swinging within the immediate resistance and support levels and displays equal possibilities to hit these levels depending on the volume induced. However, the star crypto is attempting to slice through the consolidation and quickly achieve the resistance at $48,642 to mark a healthy uptrend.
On the other hand, the price is appearing to have mirrored a prior move which may result in a steep price drain towards the demand zone of around $46,200. However, speculation about the price maintaining decent uptrend surfaces as the price is currently swinging within a strong bullish flag.
Bitcoin(BTC)/USDT Price Analysis (Short-Term)
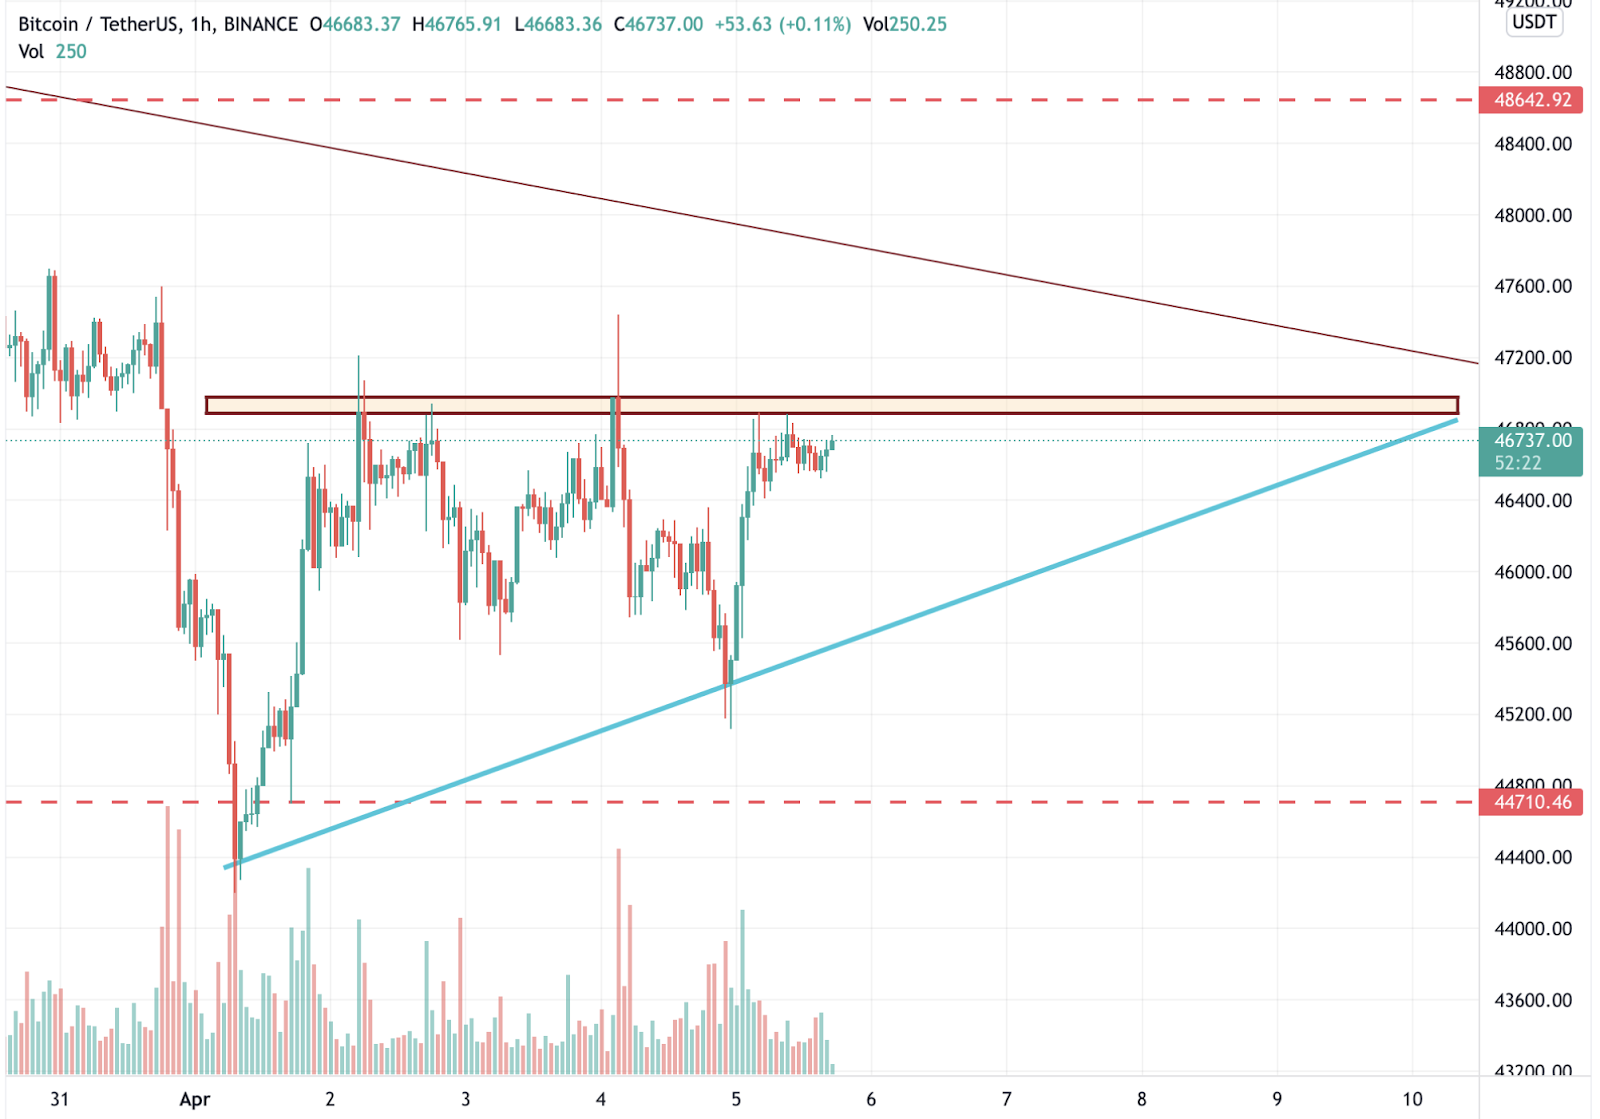
The price is swinging within an interesting phase of a couple of bullish patterns assure of significant upward momentum. The price is swinging within an ascending triangle where the apex is extremely far off. And hence the price needs to break out, then it needs to consolidate for more time, probably until the weekend to showcase the result of the pattern. On the other hand, the price appears to have reached the tip of the bull flag and waiting for strong boosts to pile up bullish momentum.
Therefore, if in case the price spikes high then the BTC price may eventually barge in through the immediate resistance levels and attempt to test the resistance of the huge symmetrical triangle formed in the higher time frame. Therefore, the day’s close is extremely important for the asset to continue with the uptrend until it ranges beyond ATH to hit $100K soon.
Bitcoin(USDT) Technical Analysis(Short-term)
| Indicators | Value | Action |
| Relative Strength Index(RSI) | 57.78 | Buy |
| MACD | 100.6 | Buy |
| Average Directional Index(ADX) | 30.26 | Buy |
| Average True Range(ATR) | 180.23 | Less Volatility |
| Bull-Bear Power | 305.144 | Buy |
Pivot Levels to Watch Out in Short-Term
Moving Average (MA) – 50:- $46,309.5
Moving Average (MA) – 200:- $46,628.8
Resistance:- $47,628
Support:- $46,524.41